

This rupture model was derived using horizontal and vertical displacement data from ten GNSS stations, averaged over the first two days following the earthquake. The model comprises a set of arbitrarily shaped polygons lying in a single fault plane (strike = 220°, dip = 28°), within which slip is assumed to be spatially uniform. Each polygon is defined as an assemblage of point sources. Slip amplitudes within the source are shown in Figures a and b in black font. The initial geometry of the polygons was constrained by the spatial distribution of aftershocks during the first week after the mainshock. Initial slip estimates were obtained from empirical scaling relationships between slip and magnitude. Subsequent adjustments to both geometry and slip distribution were made to achieve the best fit to the GNSS observations.
.png) Figures a and b present the projection of the modeled fault onto the Earth’s surface, along with a comparison between observed (red lines/arrows) and modeled (blue) displacements for each GNSS station (stations shown as triangles).
Figures a and b present the projection of the modeled fault onto the Earth’s surface, along with a comparison between observed (red lines/arrows) and modeled (blue) displacements for each GNSS station (stations shown as triangles).
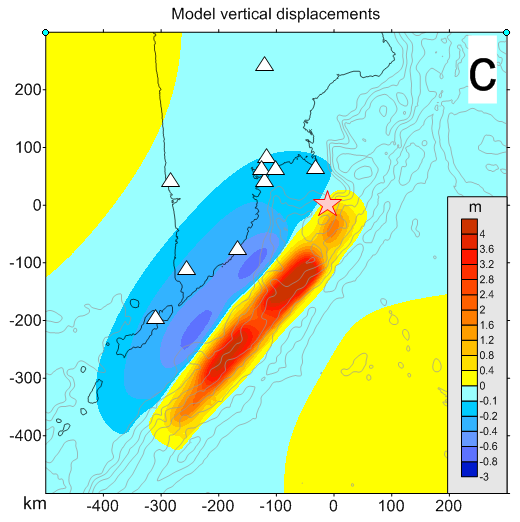
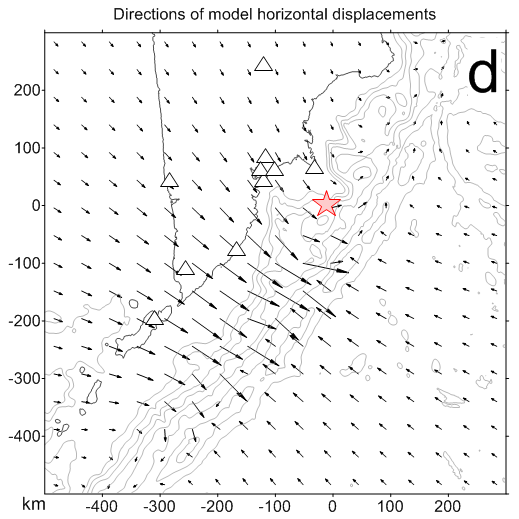
In all figures, the star symbol marks the epicenter of the 29 July 2025 megathrust earthquake. The modeled source corresponds to a moment magnitude Mw = 8.7. This work was conducted jointly by the Kamchatka Branch of FRC GS RAS (N.N. Titkov) and the IETP RAS (A.V. Lander).