

Major earthquakes of M ≥7 are complex. Seismic energy accumulation, release, and redistribution in the lithosphere are not yet well studied. The geometry, timing, and slip distribution of the complex nonlinear system of the lithospheric blocks-and-faults involved is usually not well resolved.
Their rupture may propagate both upward into the crust and downward into the mantle. As a result, the expected ground shaking could be under- or over-predicted by an order of magnitude causing unexpected societal impacts due to theerrors in seismic hazard assessment. It appears that seismic diversity is a corner stone of understanding complex dynamics of a system of blocks-and-faults in advance and after catastrophic events, the main contributors to energy release.The determination of the spatial and temporal distribution of slip over the fault area of large earthquakes is essential for better comprehension of the mechanics of the seismic rupture and its environmental impact. The integral source parameters were usedfor constraining the models of the three major earthquakes at 600 km around Anchorage, Southern Alaska(i.e., the 24 January 2016, M7.1 earthquake 86 km E of Old Iliamna, the 23 January 2018, M7.9 earthquake 280 km SE of Kodiak, and the 30 November 2018, M7.1 earthquake 14km NNW of Anchorage, Alaska). Beyond point source moment tensor and hypocenter determinations, we provide average estimates of the rupture length and width, duration, and velocity making use of the low degree moments of stress glut rate. Our analysis of the source models for the three earthquakes yields similar results to other moment tensor solutions. However for the 2018 Kodiak earthquake we infer that the conjugate plane in the final USGS NEIC solutions is the fault plane. This is similar to the findings presented in the comprehensive study by Lay et al. (2018) based on seismic, GPS, and tsunami data. They conclude a multiple fault rupture dominated by right-lateral slip on an SSE trending. Specifically, their “primary faulting with ϕ = 155° and δ = 72°, with slip of up to 15.6 m in the crust and uppermost mantle” is confirmed and complimented by our robust estimates based on the low degree moments of stress glut rate.
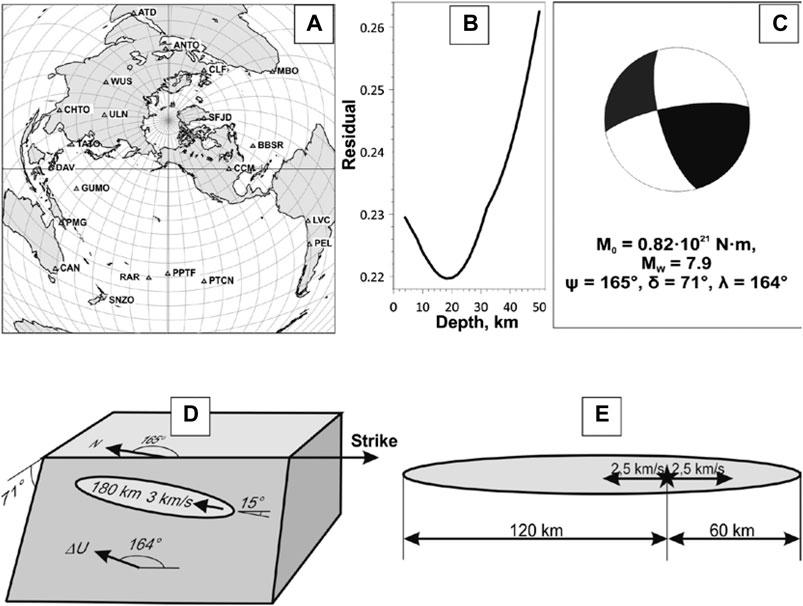 Modeling the 23 January 2018, MW7.9 earthquake: (A) stations used to determine parameters of the earthquake in the double couple approximation; (B) source depth residual function; (C) focal mechanism; (D) the earthquake focal model; (E) one-dimensional bilateral model of faulting oriented along the centroid velocity.Notes: the map (A) is centered at epicenter of the major earthquake; M0, MW, ψ, δ, λ, and ΔU are seismic moment, moment magnitude, strike, dip, slip, and vector of slip direction, respectively.
Characterization of the fore- and aftershock sequences of the recent major earthquakes in Southern Alaska confirm the existence of the long-term periods of seismic stability defined by the averages <η> of the Unfitted scaling law for earthquake (USLE) control parameter that are interrupted by mid- or even short-term bursts of activity associated with catastrophic events. However, at this time neither of the two M7.1 events considered in this study showed a change in the level of <η> observed in advance their origin times; the 23 January 2018, M7.9 earthquake may become an exception, if the level of <η> reached by the end of May 2019 persists. It seems premature to discuss if the variability of <η> can be useful in operational earthquake forecasting of seismic catastrophes, due to the yet rather small number of case studies, including thethree in Southern Alaska. Nevertheless, the apparent major seismic activity, in particular, the one associated with the M7.9 strike-slip earthquake 280 km SE of Kodiak and the most recent 22 July 2020, M7.8 Alaska Peninsula thrust faulting and 19 October 2020, M7.6 moderately dipping right-lateral strike-slip at 97 km SSE of SandPoint, Alaska, right at the borders of the rupture zone of the 1964 Great Alaska, M9.3 mega-earthquake deserves special attention, with continued further studies, and monitoring of this region.
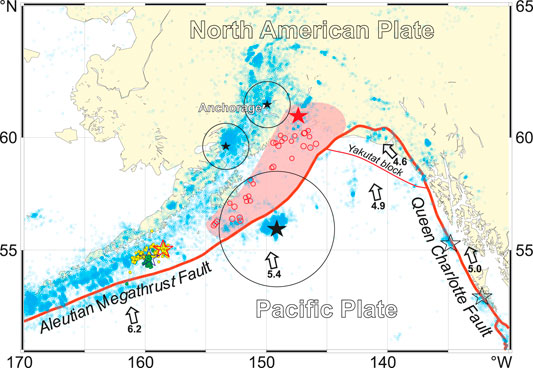 Epicenters of the M ≥ 2.5 earthquakes (ANSS, 2006-2019; small blue circles) and the three major earthquakes (black stars) in Southern Alaska. Note: The two major earthquakes of MW7.1 and the one of MW7.9 under study are encircled with R=1° and 2.5° circles, respectively. Red line marks the boundary of the North American and the Pacific Plates. The epicenters of the 1964 Great Alaska earthquake (big red star) and its first aftershocks (red circles) are given on top the subsurface rupture zone (shaded pink). The epicenters of the 22 July 2020, MW7.8 (red outline star) and its firstday M ≥ 2.5 aftershocks (small yellow circles) at 105 km SSE of Perryville,Alaska and the 19 October 2020, MW7.6 earthquake at 97 km SSE of SandPoint, Alaska (blue outline star) and its first day aftershocks (small greencircles) occurred after the manuscript submittal and acceptance,correspondingly.The directions and rates (in cm/year) of Pacific plate convergence are indicated by the arrows.
From: Bukchin B. G., Fomochkina A. S., Kossobokov V. G., Nekrasova A. K., Characterizing the Foreshock, Main Shock, and Aftershock Sequences of the Recent Major Earthquakes in Southern Alaska, 2016–2018, Frontiers in Earth Science, 8, 2020, 506, DOI=10.3389/feart.2020.584659